Thursday, August 20, 2009

Artisanal Fishery Data Available


As part of the "Impact on Marine Ecosystem" study, global artisanal fishery data has been generated by the National Center for Ecological Analysis and Synthesis and can be downloaded in a raster format here.
Of course there are the usual global dataset issues in terms of accuracy, completeness, etc. Here some background information on the creation of the artisanal fishing dataset from
A Global Map of Human Impact on Marine Ecosystems by Benjamin S. Halpern et al., published in Science on the 15th of February 2008:

Data for these variables were obtained from the CIA World Factbook (http://www.cia.gov/cia/publications/factbook), World Resources Institute EarthTrends database (http://www.earthtrends.wri.org), and ETOPO2 bathymetric data (http://www.ngdc.noaa.gov/mgg/global/relief/ETOPO2/) and included: length of coastline, shallow shelf area (<100m> proportion of population living within 100 km of the coast, per-capita GDP (calculated as the mean of this value from 2001-2003, in 2006 US dollars), unemployment rates, proportion of total protein supply from fish products, daily per capita consumption of fish and fisheries products, total number of commercial fishing vessels, total annual landings of marine animals taken for commercial, industrial, recreational and subsistence purposes, and the ratio of total landings to total number of commercial vessels.


Friday, May 29, 2009

Neighbour hood story :Google Maps Malaysia

Google has launched Google Maps Malaysia. The site includes street level data and directory listings, but not Street View. The map data has been supplied by AND Navigation, Europa Technologies, MapIT and Tele Atlas.
Derek Callow, Google's Southeast Asia head of marketing, told ZDNet Asia that the new product would let local companies add any information they choose for free. This information is not available on the international version of the site.
Speaking at the launch, Callow said the web site would help local companies list themselves on an online directory.
Google will also provide its Maps API (application programming interface), a free Javascript-based or Flash-based toolkit that enables Google Maps to be embedded in third-party sites. The embedded map is fully interactive and can be customised with location icons, photos and windows to provide all relevant information.
Google is using data from property portal iProperty, Tourism Malaysia, local lifestyle magazine KLue, and business directory listings provider Super Pages to provide its business data.
Google Maps Malaysia is also available on a variety of mobile phone platforms. To date, Google has launched localised versions of its Google Maps in Australia, New Zealand, Hong Kong, Thailand, India, Japan and Korea. Maps of Singapore are in the pipeline, but company officials did not reveal the timeline for this.
The search giant also launched Google Map Maker in the Philippines last October. The application allows users to contribute local content such as names of streets and establishments, which is later integrated with Google Maps.

Tuesday, January 27, 2009

AfricaMap beta now available - new online GIS site

The beta platform of Harvard Center for Geographic Analysis launched AfricaMap

It is a free website that brings together a huge amount of geodata on Africa. Long awaited its now publicly available. It includes a lot of data layers and is a good beginning for bringing together the available data sets of Africa.


  • Complete Soviet topographic maps at 1:500,000
  • Satellite imagery
  • Soil data
  • Ethnographic regions
  • Languages
  • HRAF + ethnologue
  • 1:2,000,000 surficial geology layer
  • 1,000,000 placenames from Geonames


Additionally many historic maps have been scanned and geo-referenced to

overlay such as the data from the Harvard Museum of Comparative Zoology,

Transatlantic Slave Trade database and A lot more!!!

Metadata is attached to vector rectangles of individual

map sheets, which all have been de-collared.

Anything not protected by Crown Copyright (or other copyright) will be available for download.


It also includes JING application which is a great app for extracting

selections from the map and exporting them to include in a publication

if you credit and cite properly.


So browse at http://africamap.harvard.edu


Some part of the data is still in the test mode (in the servers )although majority of it is

in the public website right now. It runs best on Firefox 2.0, but also runs fairly well on Internet Explorer 7.0

Thursday, January 15, 2009

Easy Elevation Download - CGIAR-CSI


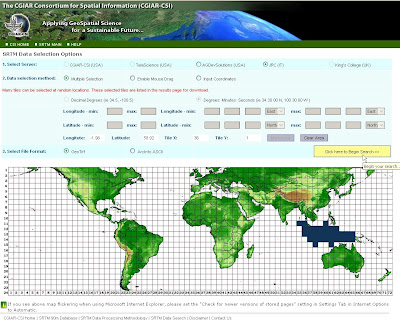
Here is something to elevate your GIS spirits. CGIAR Consortium for Spatial Information have a established a user friendly option to download SRTM elevation data which is originally produced by NASA. There is now a simple and fast way to download the SRTM tiles. Click here to access the download page. As you can see in the image above, I want to download all tiles for Indonesia. I have selected the tiles I need for this and then clicked the click here to begin search button. You will get a list of all the tiles you have selected and you can download them easily by clicking on the data download arrow.

The SRTM 90m DEM's have a resolution of 90m at the equator, and are provided in mosaiced 5 deg x 5 deg tiles for easy download and use.

Newbies: For all you newbies who are looking for contour lines, you can use these images to create them. Download the open source software MapWindow GIS. Open MapWindow GIS and click on Plugins > GIS Tools. Click on GIS Tools in the top menu and then go to raster> generate a contour Shapefile. Then specify the contour interval and directory and click Generate.

Tuesday, January 6, 2009

Image Data - for Pro's and Newbies


Pro's
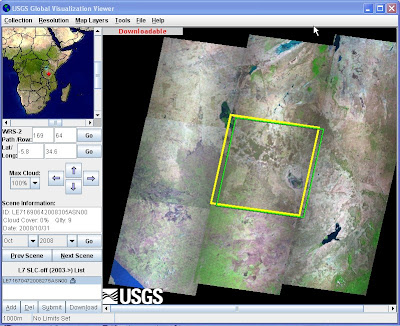
If you are looking for some nice satellite images, the USGS Global Visualization Viewer is the tool for you. Once you scroll to the image you need, right click and choose "add to list". On the bottom left hand side, click the Download button to retrieve the image. Note that most images are downloadable but some are not. Tweak the date in the of the image to find a downloadable file.
You
can also choose the collection of images on the top "Collection" menu. The Landsat Archive - "L7SLC off (2003+)" are your best choice for up to date images. However, they have some annoying lines running through them, but still they are useful for a lot of scientific work. If you just need a nice backdrop image choose Landsat Decadal and "ETM+ Pan (1999-2003)". All images have a resolution of 30m or 15m (per pixel) if pan sharpened. For a groovy display of recent or temporal data use the L7SLC images and digitize interesting features as Shapefiles, then display them on the older ETM+Pan backdrop image.

If you are working in a country with a bad internet connection make sure you install a download manager before you start the download. This will help as it resumes downloads even if the connection has been interrupted or the computer has been shutdown.
The images are zipped and around 250mb. Unzipped, they will be around 1GB. Since you will get all image bands, use the open source software OS
SIM for stacking and pan sharpening your images. Here is the link to the PDF Tutorial for the easy to use and stable software.

To unzip the images you will need to use IZArc as Winzip will not do the trick.

If this stuff bores you and you want to explore other remote sensing data options such as radar etc. use NASA's EOS Data Gateway.

Newbie
If you are a GIS newbie and don't k
now about bands and all that fun stuff, you can download pretty good images (250m resolution) from the True Marble website.

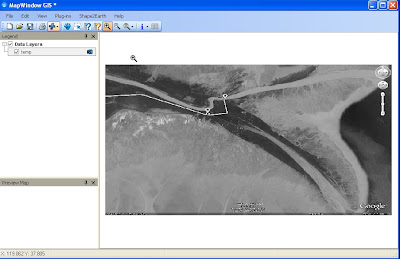
A good alternative is also to embed Google Earth images into your GIS software. Download MapWindow GIS (easy to use and stable open source GIS application) along with the Google Earth plugin. After installation, open Google Earth and navigate to the image extent you need. In the MWG Plugin Menu, select Shape2Earth. The Shape2Earth menu will appear. Here, click on "Get image from GE" and save the image to your computer. It will be georeferenced. If you need the image in color use these instructions.


If the term GIS scares you and you just want to look at an image, use Google Maps or Google Earth. Or try FlashEarth which will also show you images of other digital globe applications.

For all users with a bad internet connection try saving the Google Earth images to your hard drive by caching them. This means you can view the images using Google Earth even though you are not online. It is quite easy to do. when you have internet connection, open GE and zoom to the image you would like to save. That's it! Now go offline and you will see that this image is saved when you open Google Earth and navigate back to the previous extent.

Thursday, November 20, 2008

Live Training Seminars by ESRI.....it works at ur workplace

ESRI Live Training Seminars: dont know if many of you know about this. These hour long virtual presentations are designed for those who want GIS training on a focused topic presented live by an ESRI technical expert.

Optioned with an interactive question and answer with the presenter and presented using the broadband connection to the Internet. These are free and need Windows Media Player 9 or higher to webcast.

Keep more track at http://training.esri.com/campus/seminars/index.cfm.


Some useful tips
1Test your connection

If you have never attended a live training seminar, please follow the steps below to ensure you can connect to the presentation. The seminar uses both Windows Media Player and Adobe Flash Player.
  • Go to http://training.esri.com/lts/testpresentation2/index.cfm.
  • Log in with your ESRI global account. If you don't have an ESRI global account, click the Create New Account link. A global account is required in order to attend the seminar.
  • The test presentation window will open in a new window and, in a few seconds, you should see slides and hear music. If you do not, use the resources in the left panel for assistance.


Attend the seminar
  • Go to http://training.esri.com/campus/seminars/index.cfm.
  • Click the Attend Seminar button. The button will be active approximately 30 minutes before the seminar’s scheduled start time.
  • Log in using your ESRI global account. The presentation window will open but it may take up to a minute for you to see the first slide.

See today : ( Match you time )

Editing in ArcGIS 9: Tips and Tricks III
Thursday, November 20, 2008
9:00 a.m., 11:00 a.m., & 3:00 p.m. Pacific Time (US & Canada)
12:00 p.m., 2:00 p.m., & 6:00 p.m. Eastern Time (US & Canada)
5:00 p.m., 7:00 p.m., & 11:00 p.m. UTC/GMT

Monday, November 17, 2008

Poverty Data


What?
The Sedac Ciesin Global Distribution of Poverty site is one of the best portals for downloading poverty related geodata.
The Global Poverty Mapping Project seeks to enhance current understanding of the global distribution of poverty and the geographic and biophysical conditions of where the poor live. Here you can find poverty related data in shp, xls and csv format or create your own map online.

The global data sets include:

Infant Mortality Rates
and

Malnutrition (underweight children), all translated to a common quarter-degree grid.

The sub national data includes:

Small Area Estimate: Consumption-based poverty and inequality measures and related data for subnational administrative units in: Africa, Asia, Europe and Latin America.

Poverty & Food Security Case Studies: Poverty and food security measures for subnational administrative units in: Mexico, Ecuador, Kenya, Malawi, Bangladesh, Sri Lanka and Vietnam.

Unsatisfied Basic Needs: Measures of unmet basic needs for subnational administrative units of numerous countries in Latin America: Argentina, Bolivia, Brazil, Colombia, Ecuador, El Salvador, Guatemala, Honduras, Mexico, Nicaragua, and Peru.

How?
On the top menu click on "Datasets" and choose if you want information (data in xls format), global data (either shp or xls of all country level data) or click on national data. Here, you can download poverty data according to subnational administrative units for each country, in shp format. You can also customize this dataset and then download it in csv format.

If you don't have GIS software, click on "maps" on the main menu and either download existing poverty maps or create your own by navigating to the Sedac Map Client.

Who?
The Poverty Mapping Project at CIESIN (The Center for International Earth Science Information Network) at the Earth Institute at Columbia University is funded by the World Bank’s Japan Policy and Human Resource Development (PHRD) Fund.

When?
This Project was a partnership between CIESIN, the World Bank, and the Earth Institute at Columbia University and was undertaken in 2004-2005.